Ecosystem
- DARWIN model
A model for ocean biogeochemistry and plankton ecosystem. The original model is developed by Dutkiewitz et al. [2009]. I incorporated this model within the ECCOv4 framework [Forget et al., 2015] and added the riverine contributions of nutrients to the ocean. The model results include the concentrations of different nutrients (C, N, P, Si, Fe), phytoplankton (6), and zooplankton (2). I also archived important fluxes such as primary production, chlorophyll concentrations, particle sinking. The upper video shows 20 years monthly primary production (PP) during 1992-2011.
The model also included more sophisticated plankton food webs, such as phytoplankton, herbivore zooplankton, and carnivore zooplankton. In another version, the model also includes a >300 species to incorporate different sizes and sensitivities to temperature. The lower video shows the ecological Provinces from a computer simulation of the marine global ecosystems. Each color represents a different distinct combination of the most dominant phytoplankton function types (as shown in the Venn diagram top right). The opacity indicates the total concentration of phytoplankton biomass: the darker the color, the less phytoplankton. Animation Credit: Oliver Jahn, MIT.
- FEISTY model
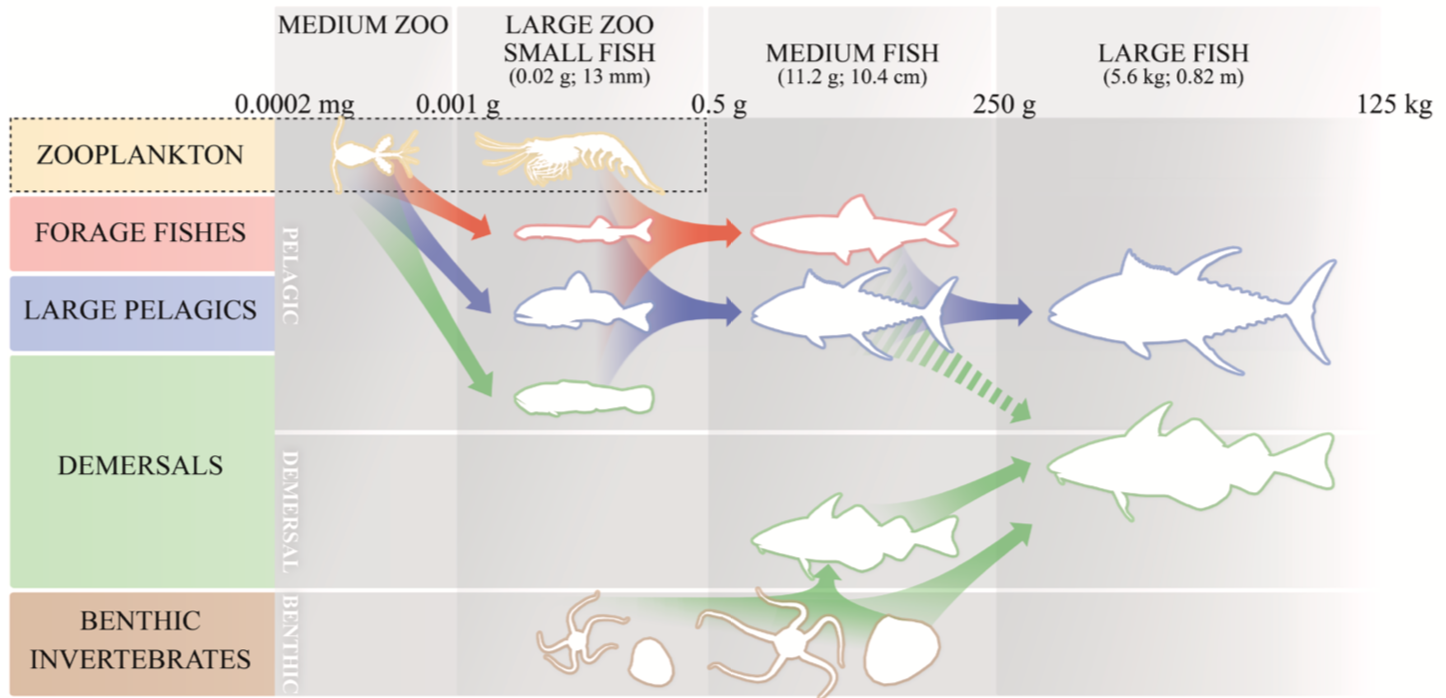
The fish model is in a size- and trait-based modeling framework developed by [van Denderen et al. 2021; Petric et al. 2019]. It comprises five fish guilds: epipelagic fish, mesopelagic fish, large pelagic fish, midwater predators, and demersal fish. Differences among fish guilds are distinguished by maximum body weight and vertical habitat strategies. Epipelagic fish and mesopelagic fish (each guild has four size groups) have smaller maximum weight than the other three (each guild has six size groups). The two largest size groups in each guild, i.e., the mature fish, allocate energy to the smallest size group as reproduction. Fish in one size group will be counted as the next larger size group when growing up. Figure credit: Petric et al. 2019.

- CLM model
This is the default land component for the Community Earth System Model Version 2 (CESM2) including comprehensive carbon and nitrogen cycles within the aboveground and belowground process. The terrestrial component is closely coupled with the atmosphere and the state of vegetation (leaf area index [LAI], steam area index [SAI], canopy top and bottom heights, etc.) is prognostically calculated. The CLM phenology model comprises multiple algorithms that regulate the movement of stored carbon and nitrogen out of storage pools for the display of new growth and into litter pools for losses of displayed growth. These algorithms represent different phenological types, each associated with a particular plant functional type (PFT).
The model adopts a demographically structured approach for the dynamic of vegetation, which is the “Functionally Assembled Terrestrial Ecosystem Simulator” in CLM5. The submodule contains vegetation competition and co-existence. It enables a biosphere representation that accounts for the division of the land surface into successional stages, as well as competition for light between height-structured cohorts of representative trees of various plant functional types. The fire emissions are coupled to the atmosphere and the soil module of CLM5 also has a relatively high vertical resolution with 25 layers extending down to 8.50 m [Lawrence et al., 2019]. Figure credit: UCAR.

